Business Analytics Blog

Lack of Financial KPI can lead to business failure

Posted by Robert Trupe
 

Personal Success of any position requires three components.

  • 1. Proper Training
  • 2. Proper Tools
  • 3. The Desire to complete the task

I would contest that if it is a lack of training or tools, the responsibility sometimes falls back to the company as well as the individual. Tools and Training are the easiest problems to solve. However, if the missing piece is lack of desire, it is difficult to help one succeed.

Accounting is a track record of how business has performed in the past. Poor accounting practices, many times get in the way of company growth. Accurate history provides a bird's eye glimpse into the future when using proper forecasting and budgeting techniques.

Even in down times, profitability can be proactively managed with the KPI Stategy. Key Performance Indicators need to be readily available to know if there is an internal problem or change in market conditions.Executive Dashboards

That being said, a solid accounting system will allow the development of business metrics and financial ratios which help monitor the growth of the company while maximizing profitability. Timely and Accurate data is needed for financial trends analysis as well as the business performance measurement. Again, accurate history is the key to understanding trends. If Financial KPI fall out of desired range, information needs to be readily available adjust business practices to maintain profitability.

KPI Examples:

KPI Examples 

Tags: Financial KPI, Data Visualization Technology, Study Groups

Business KPI strategy starts with Accounting 101

Posted by Robert Trupe
 

Successful Business KPI strategy starts with Accounting 101

Developing KPI Strategy financial ratios starts with an Optimized Chart of Accounts and understanding that you can't spend more than you make. If you don't understand this concept, your company might be the next statistic. It all starts with understanding business accounting 101. Every manager, and Government elected official should be required to understand the following principle to be eligible for their position.  This is why some businesses and our Government are going broke.

 It starts with the chart of accounts. The methodology behind the groupings as shown simplifies the understanding of financial ratios. Parent accounts are totaling accounts for their child accounts. Quick Books chart of accounts does an excellent job aOperating Expense Dashboard
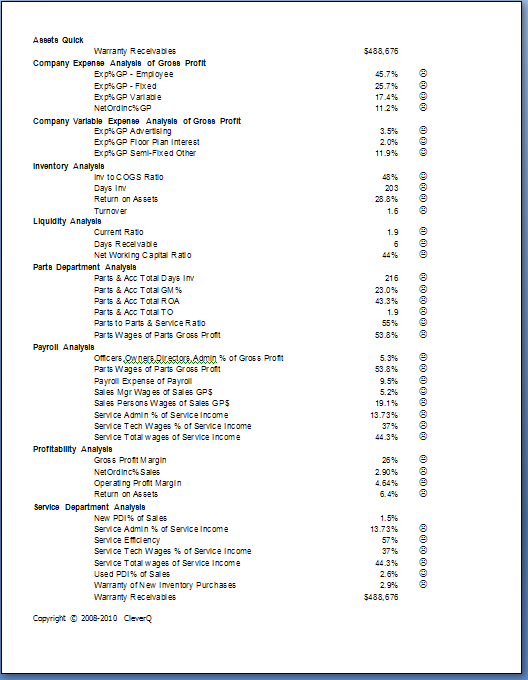
llowing for this methodology.  Successful companies, study groups and consultants commonly use this format to measure business performance. Grouping the chart of accounts is also important to compare company performance to Industry aggregate ratios if industry benchmarking is desired.  Pay special attention to the following key points.

  • If a company spends more than it makes, it will become a statistic.
  • Gross Profit is what the company makes after paying its suppliers.
  • Gross Profit is Total Income less Total COGS
  • Gross Profit is the total revenue at the company's disposal to both pay expenses and keep as ordinary income.
  • Since Gross Profit is what the company has at its disposal for expenses, we can now take the approach that we cannot spend more than we make without having a loss or negative Net Ordinary Income.
  • Expenses are broke down into Logical groupings and are grouped into Variable, Fixed, & Personal. When added to Net Ordinary Income, the total will be 100% of the Gross Profit.
  • Gross Profit = Variable Expenses + Fixed Expenses + Personal Expenses + Ordinary Income
  • Variable Expenses = Semi-Fixed Other + Advertising + Other Important variable Expense
  • Accounting Consistency and History are Key to seasonal trend analysis for forecasting and budgeting
  • Seasonality Forecasting of Income & COGS is first necessary to know how much Gross Profit we will have to spend on expenses.
  • Once seasonal trends are calculated from history for each expense bucket, monthly forecasting & budgeting can be implemented to proactively operate profitably.
  • The profit centers or departments all have mirrored Inventory, Income, COGS, and Personal expense to allow for departmentalized KPI development.
  • Each Department now can be measured to see if it can financially stand on its own, without being subsidized by another department after personal expense. 

Sample Chart of Accounts Framework:

  • 10000 Assets
    • Current Assets
      • Bank Accounts
      • Accounts Receivable
      • Other Current (Inventory)
        • Inventory Profit Center A
          • Inventory Product type 1
          • Inventory Product type 2
          • Inventory Product type 3
        • Inventory Profit Center B
      • Total Other Current (Inventory)
    • Total Current Assets
    • Fixed Assets
    • Other Assets
    • Working Assets Profit Center D (e.g. Reoccurring Revenue)
  • Total 10000 Assets
  •  
  • 20000 Liabilities
    • Accounts Payable
    • Credit Cards
    • Other Current Liabilities
    • Long Term Liabilities
  • Total 20000 Liabilities
  •  
  • 30000 Equity
  •  
  • 40000 Income Accounts
    • Profit Center A Income (Sales Dept)
      • Income Product type 1
      • Income Product type 2
      • Income Product type 3
    • Profit Center B Income (Parts Dept)
    • Profit Center C Income (Service Dept)
    • Profit Center D Income (e.g. Reoccurring Revenue)
  • Total 40000 Income
  •  
  • 50000 COGS Accounts
    • Profit Center A COGS (Sales Dept)
      • COGS Product type 1
      • COGS Product type 2
      • COGS Product type 3
    • Profit Center B COGS (Parts Dept)
    • Profit Center C COGS (Service Dept)
    • Profit Center D COGS (e.g. Reoccurring Revenue Dept)
  • Total 50000 COGS
  • Gross Profit
  •  
  • 60000 Variable
    • Other Important Variable Expense(e.g., Research & Development, Inventory Interest/Floor Plan etc.)
    • Advertising Expense (e.g., Web, Yellow Pages, TV, etc.)
    • Semi-Fixed Other (e.g., Good Will, Professional Fees, Repairs & Maintenance, Office Supplies, Continued Education, Misc Variable)
  • Total 60000 Variable
  • 66000 Employee Expense
    • Owner/GM/CEO
    • Administration
    • Profit Center A Wages
      • Management A Wages
      • Staff A Wages
    • Profit Center B Wages
      • Management B Wages
      • Staff B Wages
    • Profit Center C Wages
      • Management C Wages
      • Staff C Wages
    • Profit Center D Wages
      • Management D Wages
      • Staff D Wages
    • Payroll Expenses
  • Total 66000 Employee Expense
  • Total 69000 Fixed Expenses (e.g., Depreciation and Amortization, Insurance, Rent/Mortgage, Utilities, Data Processing, Business Loan Interest)
  •  
  • Total Expense
  •  
  • Net Ordinary Income
  • Total 70000 Other Income (Non Operating e.g, Insurance Proceeds, Interest Income, Earned Discounts, Proceeds from Sale of assets, Deposits forfeited
  • Total 80000 Other Expenses (Non Operating)
  • Total 90000 Taxes e.g., Provision for Income Tax
  •  
  • Net Other Income
  • Net Income

Copyright © 2008-2010 CleverQ

Tags: QuickBooks Dashboard, Business KPI Strategy, Financial KPI

Data Visualization Technology for Employee Performance Measurement.

Posted by Robert Trupe
 

In many cases, managers fail to provide proper employee performance reviews. At times, we spend more time managing the underperformers than we do supporting the high performers who are generating the majority of the productivity for the company. Most managers many times do not have the time, tools or knowledge to properly appraise employee performance. Furthermore, the process of filling out forms performing reviews is monotonous, sometimes a waste of time, and many times counterproductive.

I had a conversation with a business associate whom is a department manager for one of the largest retailers in the country. His remarks reminded me of prior experiences with overachieving employees. He was trying to find a method to measure his, as well as his department's performance.

The scenario was always similar. The best employees would knock on my office door. I would invite them in to sit down. After the small talk, I would ask what's on your mind. Then the question would finally come out in the fashion of "How am I doing at my job? Are you happy with my performance?" Shame on all of us as leaders and coaches! We sometimes spend so much time chasing rabbits, putting out fires, and dealing with the problem child, that we don't take time for our primary responsibility - Manage People. We sometimes ignore the best performers.

When you send your child to school, how important is it to grade every quiz and test? Do you think the child benefits by knowing their grade and attendance record? Do they respond well to a good grade, praise, and a pat on the back? Do you think they are proud of a good report card or disappointed in themselves when they under achieve?

Overachievers are nearly always self motivated and want to know their performance. Employee KPI, Employee Performance Scorecards, employee dashboards are as important to the employee as the financial reports and financial ratios are to the GM or CEO. Employee Performance measurement should be made available to employees regulData Visualization Technologyarly so individuals can manage their success.


Steps to develop KPI:

  • Organize a focus group. It should include the people taking the calls, fixing the problems, responsible for finances, etc. Keep the group well rounded with members who deal with the same problems from different perspectives, large enough to get different ideas, and small enough that decisions can be made.
  • Break down complaints, failures, problems into categories, this may come from support staff.
  • Try to keep the categories to around 8 for each sector of your business. Too many KPI for one department can become unmanageable.
  • Talk about how they relate to CSI, Costs, Efficiencies, and Revenues
  • Revisit each KPI and ask the group if each is important to monitor, or if it is a waste of time.
  • Talk about what information needs to be collected, or is being collected to measure it, or can it be collected.
  • What policies or procedures will be implemented to collect the data
  • How will it be reported
  • Who will be responsible for the project and reporting
  • How often will it be reviewed in scheduled meetings
  • Keep involving the team as to the resolutions of the KPI which are out of the desired range
  • Review your KPI periodically and decide if they are worth monitoring.


To implement a successful strategy, people must be involved in the process from the beginning. It's important that everyone buy in and take ownership. The key to developing a set of KPI is to develop a set which can be measured, and are able to put a plan into action to improve upon. History is the Key to understanding improvement!

Tags: Business KPI Strategy, Financial KPI, Data Visualization Technology, Employee Performance Measurement

KPI examples included in CleverQ

Posted by Robert Trupe

The financial KPI in the CleverQ software sample file may be applied to most businesses. The sample file contains common financial indicators as well as examples of seasonal trend analysis, trend analysis, regression analysis and forecasting. The Key Performance Indicators KPI included are a good starting point for most companies. All data, ranges, benchmarks, and business advice is the purpose of example and should be tested, modified, and validated if a user adapts any KPI or Business metrics to their own business.

Tags: QuickBooks Dashboard, Financial KPI