Analytics Software Overview
The new CleverQ Analytics software & executive dashboard software video demo gives an overview of the software without going into the depth of technical training.

The new CleverQ Analytics software & executive dashboard software video demo gives an overview of the software without going into the depth of technical training.
Tags: QuickBooks Dashboard, Analytics software, Data Visualization Technology
03/08/2010
The following enhancements have been added to the CleverQ analytics software v1.55. Many improvements are for use with QuickBooks dashboard application. QuickBooks is a registered trademark of Intuit.
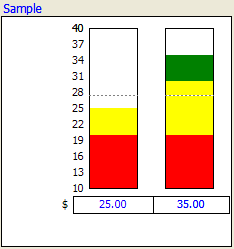 This meter is used to show two indicators. A single range is shown on the left for both bars so both indicators must have the same min and max values. The min and max values are displayed on the bottom and top of the bar. Nine intermediate values are calculated and displayed between the min and max values. A colored bar is drawn to indicate the value of each indicator. A dotted line shows the median value. The bar can take on as many as three colors. Colors are drawn based on the ranges. The actual value is displayed on the bottom of the bar and to the left the units. If the value is out of range, an out of range message will be displayed. A tip icon appears in the top right to indicate some advice is available based on the range the value is in.
Tags: QuickBooks Dashboard, CleverQ Release, Analytics software

