Analytics Software Overview
The new CleverQ Analytics software & executive dashboard software video demo gives an overview of the software without going into the depth of technical training.

The new CleverQ Analytics software & executive dashboard software video demo gives an overview of the software without going into the depth of technical training.
Tags: QuickBooks Dashboard, Analytics software, Data Visualization Technology
...is pointless unless the right combination Key Performance Indicators (KPI) are grouped and evaluated together. KPI definitions and importance are different for many companies' and/or study groups. A ratio is Key if it is actively measured, monitored and managed and deemed "Key" by management. I have listened to and read many discussions regarding the evaluation of specific KPI measurements, arguing "which KPI is best?" The answer is none. More times than not, the most adamant conversationalists often have become near sighted, and ignored other crucial indicators. Furthermore, since nearly every business is seasonal, traditional KPI formulas used by most, are useless without applying seasonally adjusted annual rates (SAAR), trend analysis, and seasonality forecasting.
For example; if May is the beginning of the selling season, October is the end, and there is the same inventory on hand in May as in October, do you have the same days inventory on hand? The answer is absolutely not. Do you think improperly calculated KPI by not allowing for seasonal trends could affect turnover, return on assets, target inventory? Unquestionably, yes. Can you accurately predict target inventory levels without knowing your desired turnover, and forecasted COGS based on seasonal trends? Only if you guess!
 The Wright Brothers Had Only Three Instrument Gauges: A stop watch, tachometer for engine speed, and an anemometer to measure wind speed. Those indicators were sufficient at the time, but the Silver Dart did not fly very far compared to the space shuttle of today. By today's standards, inventory based KPI, such as gross sales, gross profit and current inventory will get you about as far as the Wright brothers' first flight. Without data visualization technology, could you imagine astronauts flying the space shuttle... with only the help of reports... reviewing historical data after the end of each flight? Try combining the analogy of "hitting the ground at full speed" with "its water under the bridge". It's called your broke and it's too late!!!
In today's business climate, understanding the complexity and relativity of KPI is crucial to long term success. In time, ignorance will land most businesses out of business. Predictive analysis and seasonality forecasting with KPI measurements of inventory/products based business, should be performed on every product and brand to optimize product mix. Product analysis requires a combination of sales analysis and Inventory analysis. Below are samples... but not all of Product Analysis metrics.
Product Analysis (By Manufacturer, Brand & Body type)
 *Gross Margin %
All of the above metrics are important, but not all are necessary to monitor. Some metrics are used only to calculate other KPI which are regularly monitored*. Seeing pages of metrics in a report can be overwhelming for some. Inability to see KPI trends over time on a graph dilutes usefulness. But once the results are properly grouped and displayed visually, analysis becomes much easier to understand. Trends can be identified, and actuals benchmarked against forecasts, trends and budgets. With better understanding of history and trends, better management of inventory and sales decisions in the future can be made.
Market trends change quickly. National trends do not always represent company trends. Predictive analytics and seasonality forecasting allows a birds-eye-view to see trends and adjust business practices to changes in a specific market. Most businesses did not see the market change until August of 2008. Solid indicators warned of the change four months prior to the crash for many businesses. Analytic tools would have given most companies time to adjust inventories and overhead in the height of their selling season.
 View the sample companies total unit sales market trend. The blue straight line represents the general direction of company sales. The linear sales trend is calculated using 12 months rolling history after removing seasonal trends. The Red trend line represents the Quarterly moving average of actual sales after removing seasonal trends.
This graph provides a solid understanding of when the market conditions are changing. Keep in mind that trends can change due to outside conditions which are out of control of the business such as the recession of 2008-2009. Internal factors such as inventory management and sales processes can also change trends.
A scorecard for each manufacturer or product line should also be readily available to identify product trends, aid in inventory management as well as assist purchasing negotiations. Manufacturer's representatives respect solid market information and are at most times more willing to help resolve real inventory problems rather than apply unsubstantiated pressure to increase inventory levels.
Tags: Business KPI Strategy, Inventory Analysis, Data Visualization Technology
 ...or Bookkeeper? In day to day experiences with some bookkeepers and support staff comes the objection or resistance to a company successfully installing business intelligence reporting software. Most times, it is for fear of an employee loosing their responsibility of spending countless hours on tasks creating spreadsheets. Fear of a position being eliminated seems to always be lurking under the surface. The key point is that people are needed but rolls change.
 Lack of understanding or confidence is normally an underlying problem. When successful implementation takes place, employees understand the fact that quality analytic tools and data visualization tools do not replace the need of bookkeeping or business intelligence administration.
Roles change from performing the daily "busy work" tasks of spreadsheets, to becoming a student of the business and assuming a role as a business financial advisor to the company. New tools will still require administration. Data mining and visualization technology can save time and as well as provide better information. Busy work can now be replaced with smart work.
 Embracing data visualization technology and becoming a part of the solution rather than an obstacle to overcome is the better business decision. New technology is here to stay for business and creates a new opportunity for professional growth.
First steps to engaging employees in change:
For more information about steps to develop KPI, see the blog: Data Visualization Technology for Employee Performance Measurement
Personal Success of any position requires three components.
I would contest that if it is a lack of training or tools, the responsibility sometimes falls back to the company as well as the individual. Tools and Training are the easiest problems to solve. However, if the missing piece is lack of desire, it is difficult to help one succeed.
Accounting is a track record of how business has performed in the past. Poor accounting practices, many times get in the way of company growth. Accurate history provides a bird's eye glimpse into the future when using proper forecasting and budgeting techniques.
Even in down times, profitability can be proactively managed with the KPI Stategy. Key Performance Indicators need to be readily available to know if there is an internal problem or change in market conditions.
That being said, a solid accounting system will allow the development of business metrics and financial ratios which help monitor the growth of the company while maximizing profitability. Timely and Accurate data is needed for financial trends analysis as well as the business performance measurement. Again, accurate history is the key to understanding trends. If Financial KPI fall out of desired range, information needs to be readily available adjust business practices to maintain profitability.
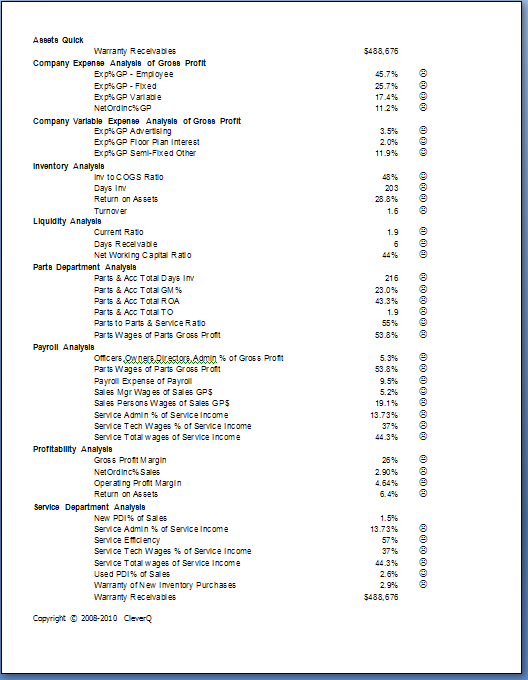
KPI Examples:
Tags: Financial KPI, Data Visualization Technology, Study Groups
In many cases, managers fail to provide proper employee performance reviews. At times, we spend more time managing the underperformers than we do supporting the high performers who are generating the majority of the productivity for the company. Most managers many times do not have the time, tools or knowledge to properly appraise employee performance. Furthermore, the process of filling out forms performing reviews is monotonous, sometimes a waste of time, and many times counterproductive.
I had a conversation with a business associate whom is a department manager for one of the largest retailers in the country. His remarks reminded me of prior experiences with overachieving employees. He was trying to find a method to measure his, as well as his department's performance.
The scenario was always similar. The best employees would knock on my office door. I would invite them in to sit down. After the small talk, I would ask what's on your mind. Then the question would finally come out in the fashion of "How am I doing at my job? Are you happy with my performance?" Shame on all of us as leaders and coaches! We sometimes spend so much time chasing rabbits, putting out fires, and dealing with the problem child, that we don't take time for our primary responsibility - Manage People. We sometimes ignore the best performers.
When you send your child to school, how important is it to grade every quiz and test? Do you think the child benefits by knowing their grade and attendance record? Do they respond well to a good grade, praise, and a pat on the back? Do you think they are proud of a good report card or disappointed in themselves when they under achieve?
Overachievers are nearly always self motivated and want to know their performance. Employee KPI, Employee Performance Scorecards, employee dashboards are as important to the employee as the financial reports and financial ratios are to the GM or CEO. Employee Performance measurement should be made available to employees regul arly so individuals can manage their success.
Steps to develop KPI:
To implement a successful strategy, people must be involved in the process from the beginning. It's important that everyone buy in and take ownership. The key to developing a set of KPI is to develop a set which can be measured, and are able to put a plan into action to improve upon. History is the Key to understanding improvement!
Tags: Business KPI Strategy, Financial KPI, Data Visualization Technology, Employee Performance Measurement

