Successful Business KPI strategy starts with Accounting 101
Developing KPI Strategy financial ratios starts with an Optimized Chart of Accounts and understanding that you can't spend more than you make. If you don't understand this concept, your company might be the next statistic. It all starts with understanding business accounting 101. Every manager, and Government elected official should be required to understand the following principle to be eligible for their position. This is why some businesses and our Government are going broke.
It starts with the chart of accounts. The methodology behind the groupings as shown simplifies the understanding of financial ratios. Parent accounts are totaling accounts for their child accounts. Quick Books chart of accounts does an excellent job a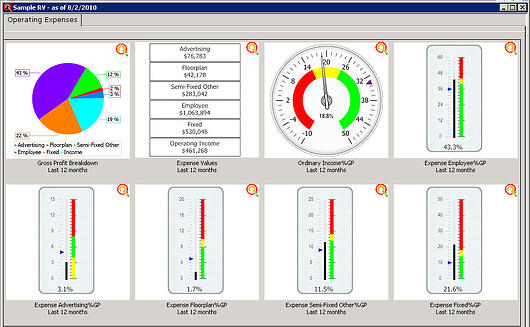 llowing for this methodology. Successful companies, study groups and consultants commonly use this format to measure business performance. Grouping the chart of accounts is also important to compare company performance to Industry aggregate ratios if industry benchmarking is desired. Pay special attention to the following key points.
- If a company spends more than it makes, it will become a statistic.
- Gross Profit is what the company makes after paying its suppliers.
- Gross Profit is Total Income less Total COGS
- Gross Profit is the total revenue at the company's disposal to both pay expenses and keep as ordinary income.
- Since Gross Profit is what the company has at its disposal for expenses, we can now take the approach that we cannot spend more than we make without having a loss or negative Net Ordinary Income.
- Expenses are broke down into Logical groupings and are grouped into Variable, Fixed, & Personal. When added to Net Ordinary Income, the total will be 100% of the Gross Profit.
- Gross Profit = Variable Expenses + Fixed Expenses + Personal Expenses + Ordinary Income
- Variable Expenses = Semi-Fixed Other + Advertising + Other Important variable Expense
- Accounting Consistency and History are Key to seasonal trend analysis for forecasting and budgeting
- Seasonality Forecasting of Income & COGS is first necessary to know how much Gross Profit we will have to spend on expenses.
- Once seasonal trends are calculated from history for each expense bucket, monthly forecasting & budgeting can be implemented to proactively operate profitably.
- The profit centers or departments all have mirrored Inventory, Income, COGS, and Personal expense to allow for departmentalized KPI development.
- Each Department now can be measured to see if it can financially stand on its own, without being subsidized by another department after personal expense.
Sample Chart of Accounts Framework:
- 10000 Assets
- Current Assets
- Bank Accounts
- Accounts Receivable
- Other Current (Inventory)
- Inventory Profit Center A
- Inventory Product type 1
- Inventory Product type 2
- Inventory Product type 3
- Inventory Profit Center B
- Total Other Current (Inventory)
- Total Current Assets
- Fixed Assets
- Other Assets
- Working Assets Profit Center D (e.g. Reoccurring Revenue)
- Total 10000 Assets
-
- 20000 Liabilities
- Accounts Payable
- Credit Cards
- Other Current Liabilities
- Long Term Liabilities
- Total 20000 Liabilities
-
- 30000 Equity
-
- 40000 Income Accounts
- Profit Center A Income (Sales Dept)
- Income Product type 1
- Income Product type 2
- Income Product type 3
- Profit Center B Income (Parts Dept)
- Profit Center C Income (Service Dept)
- Profit Center D Income (e.g. Reoccurring Revenue)
- Total 40000 Income
-
- 50000 COGS Accounts
- Profit Center A COGS (Sales Dept)
- COGS Product type 1
- COGS Product type 2
- COGS Product type 3
- Profit Center B COGS (Parts Dept)
- Profit Center C COGS (Service Dept)
- Profit Center D COGS (e.g. Reoccurring Revenue Dept)
- Total 50000 COGS
- Gross Profit
-
- 60000 Variable
- Other Important Variable Expense(e.g., Research & Development, Inventory Interest/Floor Plan etc.)
- Advertising Expense (e.g., Web, Yellow Pages, TV, etc.)
- Semi-Fixed Other (e.g., Good Will, Professional Fees, Repairs & Maintenance, Office Supplies, Continued Education, Misc Variable)
- Total 60000 Variable
- 66000 Employee Expense
- Owner/GM/CEO
- Administration
- Profit Center A Wages
- Management A Wages
- Staff A Wages
- Profit Center B Wages
- Management B Wages
- Staff B Wages
- Profit Center C Wages
- Management C Wages
- Staff C Wages
- Profit Center D Wages
- Management D Wages
- Staff D Wages
- Payroll Expenses
- Total 66000 Employee Expense
- Total 69000 Fixed Expenses (e.g., Depreciation and Amortization, Insurance, Rent/Mortgage, Utilities, Data Processing, Business Loan Interest)
-
- Total Expense
-
- Net Ordinary Income
- Total 70000 Other Income (Non Operating e.g, Insurance Proceeds, Interest Income, Earned Discounts, Proceeds from Sale of assets, Deposits forfeited
- Total 80000 Other Expenses (Non Operating)
- Total 90000 Taxes e.g., Provision for Income Tax
-
- Net Other Income
- Net Income
Copyright © 2008-2010 CleverQ