Business Dashboard & Reporting Software
 CleverQ Description
CleverQ definition
-
Clever is defined as: Smart, resourceful, Intelligent or ingenious
-
Cue(Q) by definition is a signal or stimulus that helps to solve a problem or provides information about what to do.
-
CleverQ definition: an intelligent and resourceful business dashboard software that helps identify and solve problems which provides business intelligence information to business people.
CleverQ Overview
- Training Facilitator™ - Part of the CleverQ patent pending process. When the
 icon shows up on the gauge, this means that the dashboard administrator has entered strategy training that is relative to the metric and its high, medium or low status. By clicking on the icon, an intranet web page is opened up which is named the Training Facilitator™. This provides the means to share company strategies, tactics, tips, training and hyperlinks to other sources that empower employees to understand company objectives and make the right decisions.
 - Scalable - The architecture of CleverQ allows it to be installed on a laptop or desktop for a small business and single user. The database that is installed by default is an encrypted Microsoft Data Base file. This means eliminates the need for high powered servers to calculate and store data when used for small or medium sized business. As the company grows, or if an enterprise solution is needed, the database can be upgraded to SQL express or a full version of SQL.
- Architecture - The architecture of CleverQ is different that other dashboard software. The Report and Data Extractors(RDE) summarize the data as it is loaded into the CleverQ data warehouse. This allows quicker visualization of data without an online analytical processing (OLAP) cube server. Analytical data is transparently stored so future requests for data can be served faster. Reports from the report manager can be connected to live data sources which can be opened in the information portal through dashboard gauges.
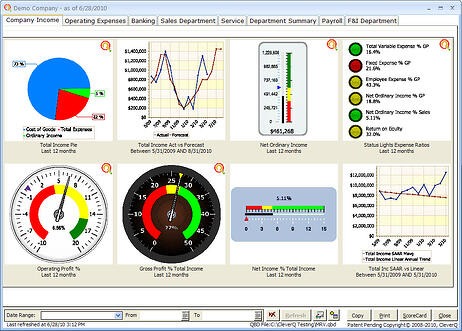
- Interactive Dashboards - Drill down on gauges to scorecards, formattable graphs, current vs previous period graphs, details, and graphs showing desired ranges with benchmarks. Additional drill downs open the enterprise information portal with live reports, details, scorecards, or drill through to open other programs.
- Web Access - Data can be uploaded to the CleverQ web service for web browser access and/or CleverQ Server can be accessed via Remote Desktop(RDP). CleverQ web service can also calculate aggregate metrics for company comparison to the upper quartile, lower quartile, median, and middle 50% benchmarks of the group.
- Multiple company - A multiple company license is included to connect and aggregate data from multiple companies. Multi companies can also be kept in separate files without totaling companies as for use by accountants and consultants.
- Multiple Data Sources - Connect to any Open Data Base Connection(ODBC), data base, QuickBooks file, or Excel spread sheets. You can even connect to an OLAP server if desired.
- Single or multiple user - If multiple users are needed, CleverQ Server can be installed on a server and accessed using Remote Desktop(RDP) for multiple users without per user licenses. CleverQ Standard is for installation on a PC which can share the data file from a shared drive. Save money on client licenses for other programs by providing access to operational CleverQ dashboards and reports.
- Affordable - The software is relatively inexpensive. Multiple servers are not required until the database grows. IT support is not needed until an enterprise level solution is reached. And the business dashboard project is a fraction of the cost of time and money.
- Easy to use - CleverQ is simpler to use than learning many desktop solutions. The learning curve is fast, and implementation can be a matter of hours or days rather than weeks or months. If the company is using QuickBooks, connection can be made, extracted and the predefined dashboards can be viewed in less than an hour. Support for installation, initial connection to QuickBooks, and a demo with your company data is included with the purchase.
- Analytics Module - The online Analytics Calculation Engine (ACE) calculates data on the fly with specialized analytics tools including seasonality forecasting, moving averages, variance, standard deviation, normalized values, trends and previous comparisons along with many other advanced math functions and a built in formula builder to make metrics building easy.
- Information Portal - Right click on any gauge and enter the user defined additional drill downs. the Information Portal provides the framework for integrating people across organizational boundaries with collaborated information such as details, reports, spreadsheets, other scorecards or dashboards, gauges including queries, web pages, files, and drill throught capability to other programs. Additional drill downs include customizable graphs for the date range, graphs comparing previous period, graphs showing ranges and benchmarks, and details that can be exported to excel.
- Report Manager - The reporting software is a highly customizable report designer and print manager that connects to any CleverQ extracted data, stored analytical data, or live data from any other data sources. Reports can be automatically scheduled to run and delivered by e-mail, saved for a web page as html, uploaded to ftp sites, or saved in files. Report designs can include any scorecard, dashboard, or metrics from CleverQ as well. Any specific report can also be launched from the information portal which is accessed from the interactive gauges on a dashboard.
- Software Development Kit(SDK) - The capability exists to build the report manager and reporting dashboards into another software application.