Interactive Dashboard - Online help
Dashboards Scorecards
Online help for viewing CleverQ interactive dashboard scorecards
The Interactive Dashboard is different than a typical report or web page in the manner that there is a program behind an interactive dashboard. Reports, Web pages, etc. are Static pictures which sometimes have links where you open other pages. The CleverQ Interactive Dashboards have drill downs & features available directly from the dashboard which launches functions within the program.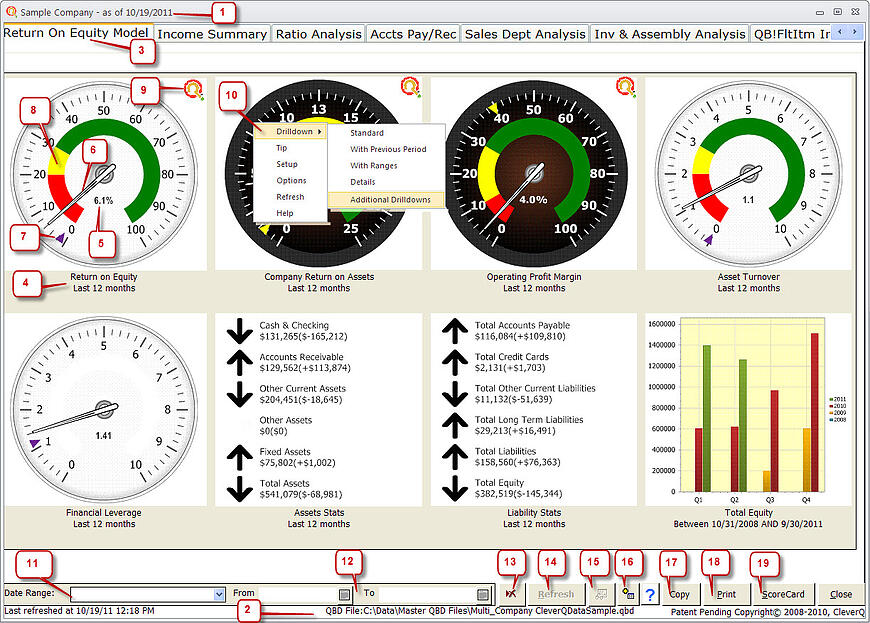
- The Company name is displayed in the title bar as set up in preferences.
- The CleverQ Data File is displayed at the bottom of the dashboard for reference. The date and time which the dashboard was refreshed is also displayed. Note: the Last refreshed date and time is NOT relevant to when data was last extracted from different sources.
- The title name of the dashboard is displayed in the tab. There are up to 8 dashboards which can be displayed in the active dashboards. Additional dashboards can be opened individually through the navigator or you may drill down to additional dashboards through a gauge if Additional Drilldowns have been set up properly in the gauge by the administrator.
- The gauge Legend lists the gauge name, the default date range for the gauge, and the filter, if the gauge is being filtered. eg., filtered by company, employee, class, job, etc.
- The value of the indicator for the date range shown.
- The needle showing the current value of the indicator relative to the gauge ranges.
- The bench mark can be any value set up by the administrator such as an industry benchmark, budget, previous period, formula, etc.
- Ranges are user defined by the administrator. They can be static numbers or formulas. Each range has the capability to return a different Tip or Advice relative to high, medium or low range of the gauge.
- An icon will appear if the administrator has entered a tip for the indicator relative to its current range. When the icon is clicked, the training facilitator will open with the advice or tip which has been set up by the administrator. Training Facilitator can contain text, links to web pages, and is HTML editable for a custom company look.
- Right Click on any gauge to open the drill down menu.
- Standard drill down will produce a graph of the data within the date range
- With Previous Period will show the graph of the date withing the date range compared to the previous date range.
- With Ranges will produce a graph of the data withing the date range in addition to the benchmank if there is one and the high, medium and low range of the gauge.
- Details will produce a report which expands all of the setup, values, notes, advice, values etc. which will give all of the details of the indicator which has been set up by the administrator.
- Additional Drill Downs are available if the administrator has set them up. Additional drill downs can include opening other dashboards, gauges, reports, programs and web pages from the gauge.
- Tip returns the conditional advice which has been set up by the administrator.
- Setup allows the administrator the ability to drill down directly to the gauge setup form and further to the indicator setup form. You must be an administrator to have this feature.
- Options may be available for select gauges.
- Refresh will recalculate and repaint the gauge. This is usually only necessary if the administrator has change something in setup and wants to see the changes.
- Help will open a window describing the basic gauge features.
- To change the date range of the entire dashboard, select a dynamic date range and refresh the dashboard (14)
- To specify a date range, select the from and to dates and refresh the dashboard (14).
- Select the delete button to clear the date range and return to the dashboard and/or gauge default date range.
- Refresh the dashboard after changing any date ranges.
- Enlarge the dashboard to full window size.
- Open additional Dashboard. If you are using multiple screens, the CleverQ Program window can be stretched. Multiple dashboards and other windows can be open at the same time.
- Copy the current dashboard to your clip board to be pasted into other documents such as e-mails.
- Print the current dashboard to a printer.
- Open a scorecard showing the gauge, tips, formulas, notes, parameter values, etc. for details for each gauge on the current dashboard or all active dashboards.