CleverQ gives you two different levels of regression analysis.
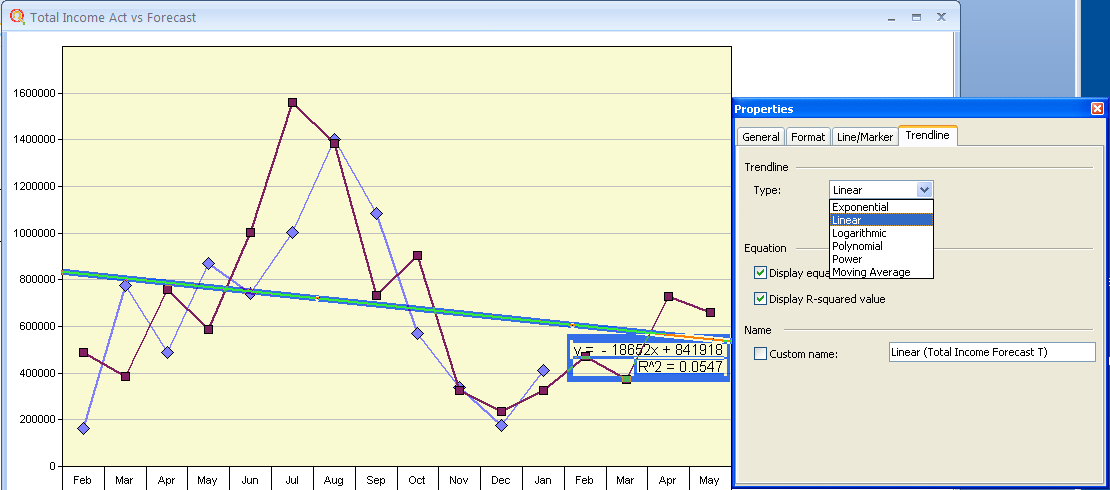
One option is to add a regression analysis line to any graph. You can then export the data from the graph to pivot tables to further analyze your data.
Nested Regression Analysis at formula level
CleverQ also gives you the capability beyond simple regression analysis. CleverQ has built in forecasting functions at that formula level so you can calculate metrics using forecasted data adjusted for seasonal trends. CleverQ's functions give you the choice to forecast raw or calculated data, best fit forecasting based on the R squared value, and adjusted for seasonal trends. You can now use forecasted data nested in your formulas to provide you with the tools to calculate nearly any forecasted business metric imaginable.
The red Line in the graph above is applying a quarterly moving average to target Inventory which is based on seasonally adjusted forecasted Cost of Goods and desired turn over. CleverQ is doing all of the calculating from raw data using only the Cost of Goods data and a desired turnover level. This is a exclusive CleverQ feature not available in other software that simply offer calculated fields or columns.