Management Performance Software
Systematically link core business processes and activities to monitor and compare your organization’s key performance indicators against defined goals and benchmarks.
Business Intelligence Platform
Calculate nearly any metrics or key indicator and display it on a simple gauge on the dashboard. Create custom dashboards for any department or position. Drilldown through gauges to multiple graphs and details. From any gauge, click on the CleverQ and open your own company intranet with high, medium or low conditional advice. Print Scorecards from any dashboard. Creat custom reports with the reports builder.
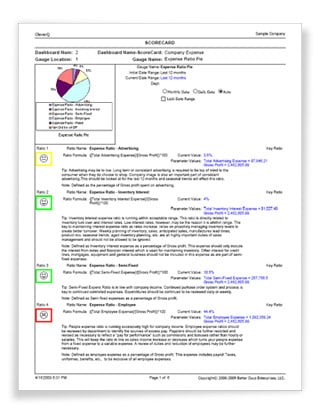
Dashboard Reporting
View key performance indicators (KPIs) through simple visual graphics - gauges, charts, and tables. CleverQ™ presents a wide number of different metrics in consolidated dashboards for an immediate look at the current operational state of any business sector.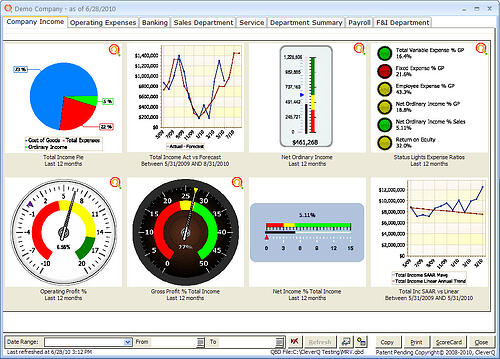
Features Include:
- Report Manager :: build and customize filterable reports according to defined criteria.
- Web-based Reporting :: access information remotely from any internet browser via Remote Desktop or CleverQ Web Dashboard.
- Preferences :: customize gauges with your company logo, set security levels for users and groups, and add unlimited departments.
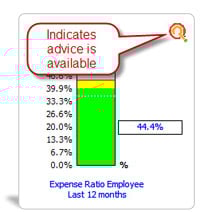 Training Facilitator
To facilitate communication throughout the organization, from upper management to the front end, an icon will appear on a gauge to indicate advice is available. The tip advice is editable with either text or an HTML editor to give a complete customized look and advice for the company.