Benchmarking software
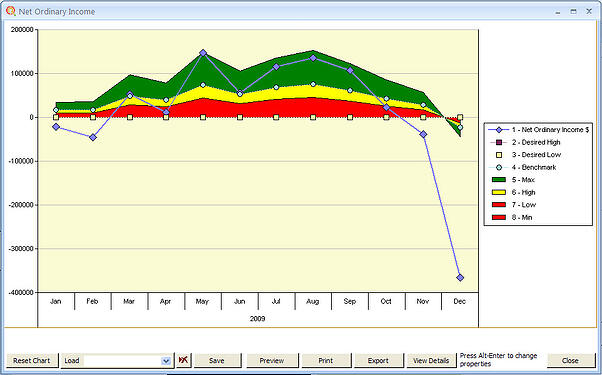
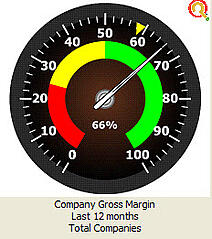
CleverQ™ Software includes analytical software and highly flexible benchmarking capabilities, as well as direct access to almost any data source. This real-time visual analysis includes charts, metrics and selections. The yellow pointer indicator is the benchmark, and the needle indicator is the current value for the financial indicator.
Industry Benchmarking
See at a glance the relative performance of a business object compared to industry benchmarks, previous years, total companies, budgets, static values or formulas. Create Key Performance Indicators and identify under-performing assets by quickly and easily comparing costs, cycle time, productivity, or the quality of specific processes. Compare the results to your business goals, forecasted data, budgets, study group comparisons, or Industry benchmarks from either internal or external sources. Results are presented and compared as easy to read gauges, charts and graphs and drill downs to data.