Income Summary
Financial Dashboard
The Income Summary is one of the financial dashboard (s) which are included out of the box with CleverQ. Default Date Range is set for a rolling 12 month year. All Dashboards, Gauges, can be customized by your company's CleverQ Administrator. Date Ranges can change by the end user and/or defaults can be changed by your CleverQ administrator.
Click the Link below to see example of:
On-Line Help for Live Dashboard Features
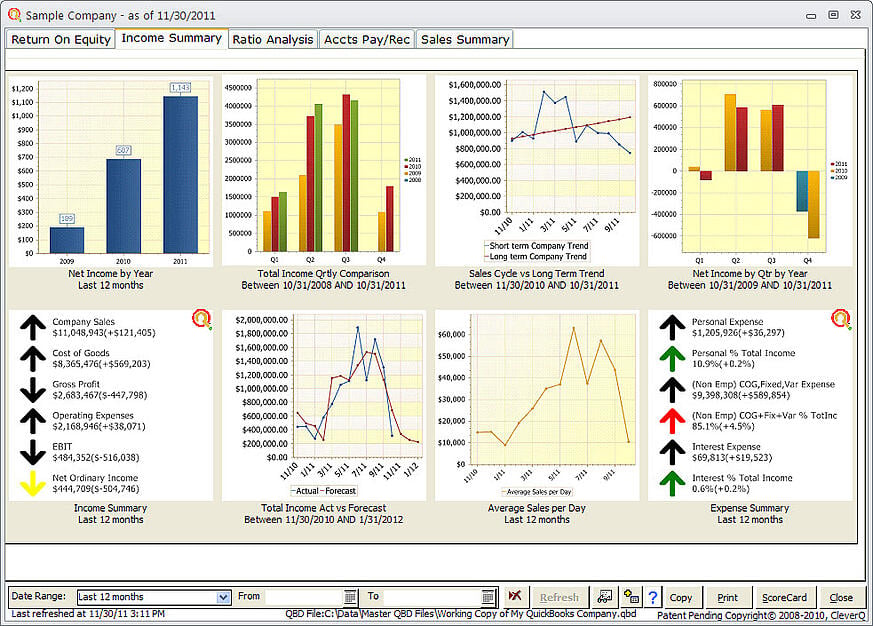
Gauges are in order from top left to right 1-4 and bottom left to right 5-8
- Bar chart of Income by Year
- Total Income Quarterly Comparison to Previous Year Quarters.
- Long term Company Trend shows Annualized and Normalized Income with Seasonal Trends Removed compared to the Long term Company trend which is represented by the linear trend which is Annualized and Normalized with Seasonal Trends removed.
- Net Income by Quarter compared to Previous Year Quarters.
- Profit & Loss Summary with change and direction of change from previous period
- Actual Income Graph with forecasting Income using a proprietary logarithm adjusted for seasonal trends.
- Average Sales per Day Graph
- Expense Summary with change and direction of change from previous period