Business Analytics Blog

Top 10 Business Intelligence BI Software Considerations

Posted by Robert Trupe
Top Ten Issues to consider with Dashboard Software
  1. Windows Based Clients are Smarter
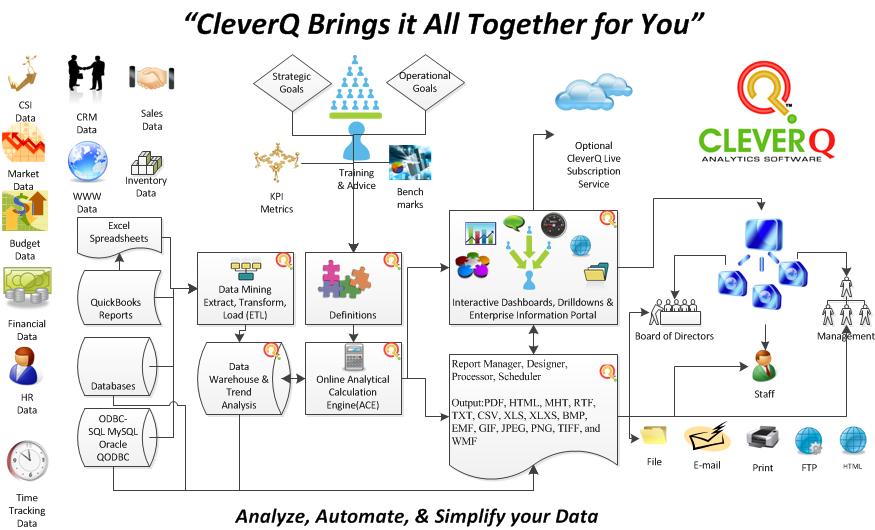
    • The bottom line is that Windows client software are Smarter. Does the dashboard software offer a very robust set of tools including Executive Dashboard Reporting Software, Data Reporting Tools, Analytics Calculation Engine (ACE), Seasonality Trend Forecasting, and Data Mining Software? Does it include an Enterprise Portal to tie relative data sources together as well as a Training Facilitator to share your Stored your Business Intelligence Advice relative to the status each of your Key Performance Indicators (KPI)?
  2. Flexibility, Connectivity & Scalability
    • Is the application scalable from a small business single user to enterprise with multiple users and multiple companies? Are there limitations to the number of custom dashboards, reports, and KPI you can build yourself? Can you connect to nearly any open data source in all of your other business applications and collaborate your Business intelligence into visualizations and automated reports? Is the dashboard software designed for Small and Medium sized businesses, and scalable for Enterprise companies who need full multi-location integration and access using the World Wide Web?
  3. Web Based “Cloud” Dashboards are not Interactive
    • With most web applications, you cannot drill down to details, graphs, change date ranges, open other local applications, export your data as easily, and build custom reports. In a Web environment, there are constraints by the Web browser and network environment.
  4. Are Dashboards accessible via the web
    • If you want to access your data via the Web, there are many secure tools to access your dashboard software and your other local applications. Secure VPNs (Virtual Private Networks), RDP (Remote Desktop Protocol), GoToMyPC, and other remote access tools to view your sensitive business data. If you simply want your custom reports and dashboards sent to your Smart phone or Smart Pad device, can you send them automatically every day via e-mail with a built-in report Scheduler?
  5. Time and Money
    • Many business intelligence software licensing starts at $15,000 - $100,000 and take months for implementation. Can implementation be done in less than an hour (for use with QuickBooks Dashboard and QuickBooks Reporting) with predefined financial indicators, dashboards and reports? Can you build Custom Dashboards and Custom Reports as you go? Are there monthly subscription fees? If you want to stay updated each year, how much do you pay? Do you have to repurchase the entire software, or just a fraction of the price?
  6. Tighter security over your business data
    • With a local application, your data stays in your control behind your firewall at your business in an encrypted secure database. Is your data susceptible to hackers, internet service interruption, or a provider going out of business?
  7. Data Source Integration
    • Composite applications are the future. A composite application is simply a framework that ties together several existing applications. Integration of Data from applications such as QuickBooks, Multiple Company files, Sage Act, Microsoft Project, Microsoft Dynamics, Excel Spreadsheets, and Data bases are essential for financial and operational KPI and Reporting.
  8. Cross-platform issues
    • Are you forced to use a specific browser to access your data? If you are using a Macintosh, can you access your data on a Terminal server using Remote Desktop or other tools such as Go to My PC?
  9. Human resources
    • Will the dashboard software eliminate wasted countless hours of crunching redundant numbers in Excel? Excel continues to be one of the most important tools in business, but can you save time and money by reducing its usage? Does the application connect to Excel and collaborate spreadsheets? Can the days of manually cutting, pasting, and updating spreadsheets may be reduced or eliminated? Can you save human resources and help your employees get back to more productive tasks? Will the time savings return your investment for dashboard software in a short time?
  10. More for your Money
    • No other single application offers as much as CleverQ Analytics Software without spending tens of thousands of dollars for other Business Intelligence Platforms and multiple software packages. CleverQ is affordable for the small business, powerful enough for medium business, and scalable to enterprise.
Dashboard Software

Tags: QuickBooks Dashboard, Dashboard Software, Data Reporting Software, Executive Dashboard, QuickBooks Reporting

Financial Analysis is not Accounting

Posted by Robert Trupe

Financial Analysis

      The role of the financial manager is tightly aligned with the strategic management of the company. The CEO relies on the financial analysis of the financial manager to align day to day operations and decisions with strategic goals. Although the accountants play an important role in scorekeeping for past performance, it is the financial manager who helps guide the company with future endeavors.
     It is interesting to discuss the difference between profits compared to cash flow and the relation to making business decisions. A business opportunity which may unfold profits in the future may not be in the best interest of the company due to the demand on cash flows which could jeopardize daily operations and other business opportunities which may arise.
     I have run into many business owners who do not realize the dislocation and differentiation between cash flows and profits. A common question by many small business owners is: “How can I make X amount of profits and be short of cash. Cash flow shortages can be detrimental to the health of a company. The concept of managing a business based on cash flows with profits being secondary may be one of the most important lessons to be learned for business success.

Financial Analysis

How Financial Management differs from Accounting:

      Both the accountant and the financial manager deal with cash flows. An accountant produces cash flow statements as a part of business financial reporting which contain the Profit & Loss, Balance Sheet (Financial Statement), and Statement of Cash flows.
     The main difference is that the accountant deals with documenting the past by “counting” historical transactions and organizing the results into accurate reports. This gives the CEO and Finance manager Past and Current picture of the company. Think of the accountant as the scorekeeper of a basketball team. They have an effect on the coach (CEO) and players by keeping score and showing past performance, but they do not necessarily produce a future game plan for future decision making (Strategic Management). The accounting role of accumulating accurate history and current status is very important to the CEO/Financial Manager because past history gives us a pattern which we can use to predict the future.
     The Financial manager differs by filling the roll of using the history, trend analysis, predictive analysis and business analysis tools to predict the future thereby advising the CEO of the potential risk/reward. The financial manager is the fortune teller whose crystal ball is in part the set of analytical tools CleverQ software provides. He or she uses the historical data to monitor financial metrics, predict sales, inventory demands, cash flows, and weigh risk. As a result of the financial manager’s advice, the CEO can adjust the game plan to maintain the course of the strategic goals while making returns to the stockholders and winning the game.
     The financial manager is not only worried about cash flows. He weighs cash flow with risk and profit. If immediate cash flow was the only factor for the financial manager to consider, he or she may advise the CEO to liquidate assets which would be the wrong thing for the company’s future profits. It is the assessment and balances all of the factors which produce the best outcome for the company.

Tags: Financial Analysis, Financial Metrics, Trend Analysis

CleverQ Analytics Dashboard software Video

Posted by R&K Trupe

 Analytics Software Overview

The new CleverQ Analytics software & executive dashboard software video demo gives an overview of the software without going into the depth of technical training.

Executive Dashboard Software Video Demo

  • Balanced Scorecard software to print of for meetings
  • Report manager software to print metrics
  • Web Dashboard to share business metrics via the Web
  • Designed for use with QuickBooks
  • Basic setup in hours rather than weeks or Months
  • Combine data from multiple Quickbooks reports and other data sources
  • Tags: QuickBooks Dashboard, Analytics software, Data Visualization Technology

    CleverQ v1.55

    Posted by Robert Trupe

    CleverQ Release

    03/08/2010

    The following enhancements have been added to the CleverQ analytics software v1.55. Many improvements are for use with QuickBooks dashboard application. QuickBooks is a registered trademark of Intuit.

    • Added new Vertical 2 Bar Gauge. Vertical 2 bar gauge
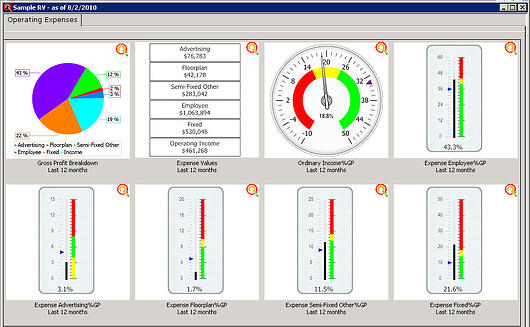
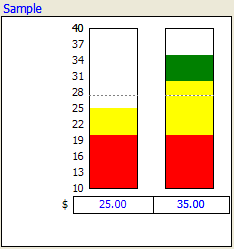
This meter is used to show two indicators. A single range is shown on the left for both bars so both indicators must have the same min and max values. The min and max values are displayed on the bottom and top of the bar. Nine intermediate values are calculated and displayed between the min and max values. A colored bar is drawn to indicate the value of each indicator. A dotted line shows the median value. The bar can take on as many as three colors. Colors are drawn based on the ranges. The actual value is displayed on the bottom of the bar and to the left the units. If the value is out of range, an out of range message will be displayed. A tip icon appears in the top right to indicate some advice is available based on the range the value is in.
    • Added * wildcard on filters when viewing extracted data.
    • Allow 30 day trial customers to get updates
    • Resized Navigator to fit in 1024x768
    • Add options for using filters on QuickBooks reports: Payroll Summary, Sales by Items Summary,
    • Inventory Evaluation. If a filter is specified, both the unfiltered and filtered reports will be extracted.
    • Add filter to Sales by Rep Summary
    • Added additional errorhandling for extracting QuickBooks data
    • Added Properties button on Pivot Charts in lieu of right-mousing clicking for runtime version. Button is always there for convienience.
    • Added new QuickBooks Report Extractions (Some with Filters):
    • P & L Budget Overview by Account
    • Sales by Item by Rep Summary
    • Sales by Customer Summary
    • Open Sales Orders by Item
    • Open Sales Orders by Rep
    • Open Sales Orders by Item by Rep
    • Inventory Stock Status
    • Added filters for QB Report Extractions: Profit & Loss, A/P Aging, A/R Aging

    Tags: QuickBooks Dashboard, CleverQ Release, Analytics software

    Is Business Trend Forecasting Really Possible?

    Posted by Robert Trupe

    Trend Forecasting

    KPI measurement as a snap shot in time is a risk in itself. Without trend forecasting of the metrics used to assess KPI, there is no indication of whether a business or market is on the mend, on the way out, or what may be the cause of a problem. Seasonal trend analysis and the ability to "normalize" metrics are the only true way to benchmark with other outside sources or company history.

    KPI assessment and measurement is purely speculative without reconciliation and verification of the core data. So when someone asks if you can really measure risk, the answer is yes. Do most practice reconciliation? Most businesses reconcile their bank balance. Few reconcile inventories more than taking annual inventory. Some reconcile floor plan accounts only because the lender sends a representative periodically for flooring checks. But for the most part, most businesses do not reconcile or verify the data enough to rely upon it. The adage, "garbage in-garbage out," is especially true with KPI measurement.

    Steps to identify the direction of any metric, company or market:

    • Normalized Sales Trend
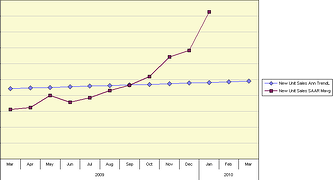
Calculating seasonal trends of the metric
    • Remove trends from data (Normalize or Seasonally adjust)
    • Apply linear trend to the normalized metric and chart on a graph comparing quarterly moving average of the same normalized metric
    • Monitor actual metric with forecasted metric on an additional graph

    Proper grouping of related metrics and monitoring relative movement is also key to understanding change. Viewing mounds of printed numbers without visualizing the trends and relative timing of key metrics becomes overwhelming for the most intelligent analyst.
    Inventory analysis dashboard
    Assessing KPI strategies without the history & the tools of budgeting and forecasting software is asking for failure. Frankly, without two plus years of solid monthly data, my advice is to asses risk at your own risk. It has come time that the lender, CEO, department manager, and even the employee should require monthly metrics to monitor performance and bring awareness of changing trends. This practice nurtures responsibility and "taking ownership".

    KPI monitoring and based totally on mathematical analysis is ridiculous. With the aid of a few tools combined with solid judgment, book keepers and managers can become analysts and consultants.

    Predictive analytics is on the forefront of analysis. It also encompasses "Relative timing" of other metrics. When metrics are compared to other metrics, there are patterns that emerge, which cannot be seen by traditional assessment. However, understanding that the change in one metric will relatively have an effect on other metrics, which provides unfair insights resulting in advanced business decisions.

    For example; in the recreational vehicle industry where discretionary spending is driving sales, large ticket sales historically had a lag time behind inverted prime. Fuel prices and a few other economic metrics impact sales as well. Understanding predictive analytics requires knowledge of relative timing and reaction between key metrics. With the understanding of inverted prime, fuel prices, new home construction starts, an RV company could adjust large ticket inventories and adjust for the market change with a couple months advanced lead time.

    Inventory Forecast
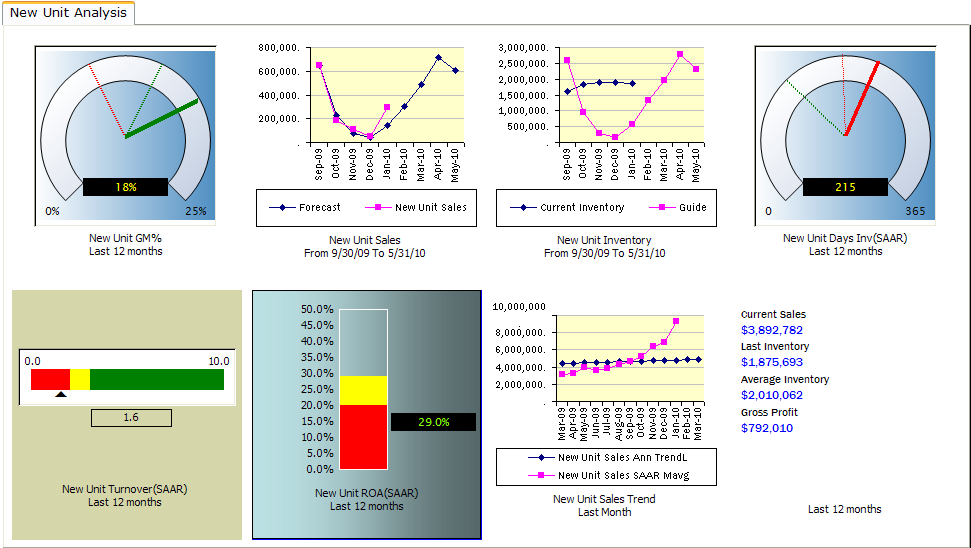
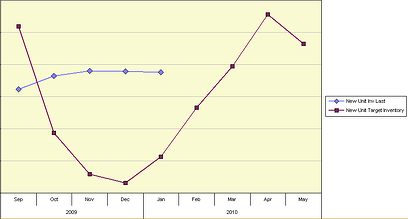
Forecasted seasonally adjusted COGS allows calculations of target seasonal inventory levels based on desired annual turnover. When seasonal trends are removed from sales data, a rolling quarter moving average compared to the linear sales trend visualizes market change directions. When collectively monitored with inverted prime, you can add judgment to the equation, and adjust inventories in advance. The understanding of monitoring metrics holistically allows the birds-eye-view into the future.

    Tags: Inventory Analysis, Seasonality Forecasting, Trend Forecasting, forecasting and budgeting software

    Nearsighted KPI Evaluation

    Posted by Robert Trupe

    KPI Monitoring

    ...is pointless unless the right combination Key Performance Indicators (KPI) are grouped and evaluated together. KPI definitions and importance are different for many companies' and/or study groups. A ratio is Key if it is actively measured, monitored and managed and deemed "Key" by management. I have listened to and read many discussions regarding the evaluation of specific KPI measurements, arguing "which KPI is best?" The answer is none. More times than not, the most adamant conversationalists often have become near sighted, and ignored other crucial indicators. Furthermore, since nearly every business is seasonal, traditional KPI formulas used by most, are useless without applying seasonally adjusted annual rates (SAAR), trend analysis, and seasonality forecasting.

    For example; if May is the beginning of the selling season, October is the end, and there is the same inventory on hand in May as in October, do you have the same days inventory on hand? The answer is absolutely not. Do you think improperly calculated KPI by not allowing for seasonal trends could affect turnover, return on assets, target inventory? Unquestionably, yes. Can you accurately predict target inventory levels without knowing your desired turnover, and forecasted COGS based on seasonal trends? Only if you guess!

    Wright BrothersThe Wright Brothers Had Only Three Instrument Gauges: A stop watch, tachometer for engine speed, and an anemometer to measure wind speed. Those indicators were sufficient at the time, but the Silver Dart did not fly very far compared to the space shuttle of today. By today's standards, inventory based KPI, such as gross sales, gross profit and current inventory will get you about as far as the Wright brothers' first flight. Without data visualization technology, could you imagine astronauts flying the space shuttle... with only the help of reports... reviewing historical data after the end of each flight? Try combining the analogy of "hitting the ground at full speed" with "its water under the bridge". It's called your broke and it's too late!!!

    In today's business climate, understanding the complexity and relativity of KPI is crucial to long term success. In time, ignorance will land most businesses out of business. Predictive analysis and seasonality forecasting with KPI measurements of inventory/products based business, should be performed on every product and brand to optimize product mix. Product analysis requires a combination of sales analysis and Inventory analysis. Below are samples... but not all of Product Analysis metrics.

    Product Analysis (By Manufacturer, Brand & Body type)

    • Product Analysis*Gross Margin %
    • Gross Profit $
    • Sales seasonal trend
    • Gross Sales
    • *Sales (SAAR)
    • COGS
    • COGS seasonal trend
    • COGS Forecast
    • Forecasted COGS
    • *Target Inventory
    • Current Inventory
    • *Last Inventory
    • Average Inventory
    • *Days Inventory (SAAR)
    • *Turnover (SAAR)
    • Desired Annual turnover
    • *Return on Asset
    • Unit Sales Annualized Linear Trend
    • Unit Sales quarterly moving average (SAAR)
    • *Warranty Claims % of COGS
    • *Warranty Shortages % of Warranty Claims

    All of the above metrics are important, but not all are necessary to monitor. Some metrics are used only to calculate other KPI which are regularly monitored*. Seeing pages of metrics in a report can be overwhelming for some. Inability to see KPI trends over time on a graph dilutes usefulness. But once the results are properly grouped and displayed visually, analysis becomes much easier to understand. Trends can be identified, and actuals benchmarked against forecasts, trends and budgets. With better understanding of history and trends, better management of inventory and sales decisions in the future can be made.

    Market trends change quickly. National trends do not always represent company trends. Predictive analytics and seasonality forecasting allows a birds-eye-view to see trends and adjust business practices to changes in a specific market. Most businesses did not see the market change until August of 2008. Solid indicators warned of the change four months prior to the crash for many businesses. Analytic tools would have given most companies time to adjust inventories and overhead in the height of their selling season.

    Market Trend
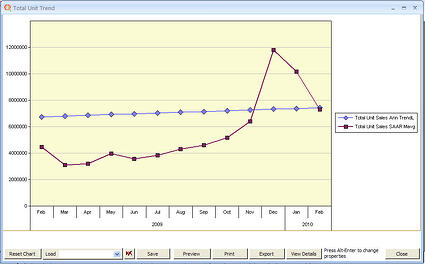
View the sample companies total unit sales market trend. The blue straight line represents the general direction of company sales. The linear sales trend is calculated using 12 months rolling history after removing seasonal trends. The Red trend line represents the Quarterly moving average of actual sales after removing seasonal trends.

    This graph provides a solid understanding of when the market conditions are changing. Keep in mind that trends can change due to outside conditions which are out of control of the business such as the recession of 2008-2009. Internal factors such as inventory management and sales processes can also change trends.

    A scorecard for each manufacturer or product line should also be readily available to identify product trends, aid in inventory management as well as assist purchasing negotiations. Manufacturer's representatives respect solid market information and are at most times more willing to help resolve real inventory problems rather than apply unsubstantiated pressure to increase inventory levels.

    Tags: Business KPI Strategy, Inventory Analysis, Data Visualization Technology

    Employee resistance to Business Intelligence Reporting Software

    Posted by Robert Trupe

    Business Financial Advisor

    Accounting figure...or Bookkeeper? In day to day experiences with some bookkeepers and support staff comes the objection or resistance to a company successfully installing business intelligence reporting software. Most times, it is for fear of an employee loosing their responsibility of spending countless hours on tasks creating spreadsheets. Fear of a position being eliminated seems to always be lurking under the surface. The key point is that people are needed but rolls change.

    Financial Dashboard
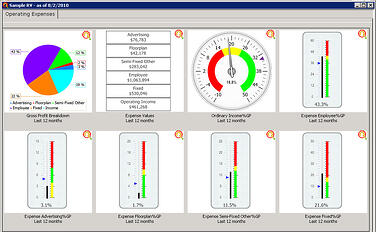
Lack of understanding or confidence is normally an underlying problem. When successful implementation takes place, employees understand the fact that quality analytic tools and data visualization tools do not replace the need of bookkeeping or business intelligence administration.

    Roles change from performing the daily "busy work" tasks of spreadsheets, to becoming a student of the business and assuming a role as a business financial advisor to the company. New tools will still require administration. Data mining and visualization technology can save time and as well as provide better information. Busy work can now be replaced with smart work.

    Data Visualization TechnologyEmbracing data visualization technology and becoming a part of the solution rather than an obstacle to overcome is the better business decision. New technology is here to stay for business and creates a new opportunity for professional growth.

    First steps to engaging employees in change:

    • Conduct a focus group meeting regarding need for KPI strategy
    • Actively include group members thoughts in focus group conversation
    • Include members in the product investigation process
    • Provide the tools and training for implementation
    • Have written out measurable goals with assigned responsibility
    • Measure progress towards goals regularly
    • Keep the team involved in the problem and resolution process

    For more information about steps to develop KPI, see the blog: Data Visualization Technology for Employee Performance Measurement


    Tags: Business KPI Strategy, Data Visualization Technology

    Lack of Financial KPI can lead to business failure

    Posted by Robert Trupe
     

    Personal Success of any position requires three components.

    • 1. Proper Training
    • 2. Proper Tools
    • 3. The Desire to complete the task

    I would contest that if it is a lack of training or tools, the responsibility sometimes falls back to the company as well as the individual. Tools and Training are the easiest problems to solve. However, if the missing piece is lack of desire, it is difficult to help one succeed.

    Accounting is a track record of how business has performed in the past. Poor accounting practices, many times get in the way of company growth. Accurate history provides a bird's eye glimpse into the future when using proper forecasting and budgeting techniques.

    Even in down times, profitability can be proactively managed with the KPI Stategy. Key Performance Indicators need to be readily available to know if there is an internal problem or change in market conditions.Executive Dashboards

    That being said, a solid accounting system will allow the development of business metrics and financial ratios which help monitor the growth of the company while maximizing profitability. Timely and Accurate data is needed for financial trends analysis as well as the business performance measurement. Again, accurate history is the key to understanding trends. If Financial KPI fall out of desired range, information needs to be readily available adjust business practices to maintain profitability.

    KPI Examples:

    KPI Examples 

    Tags: Financial KPI, Data Visualization Technology, Study Groups

    Business KPI strategy starts with Accounting 101

    Posted by Robert Trupe
     

    Successful Business KPI strategy starts with Accounting 101

    Developing KPI Strategy financial ratios starts with an Optimized Chart of Accounts and understanding that you can't spend more than you make. If you don't understand this concept, your company might be the next statistic. It all starts with understanding business accounting 101. Every manager, and Government elected official should be required to understand the following principle to be eligible for their position.  This is why some businesses and our Government are going broke.

     It starts with the chart of accounts. The methodology behind the groupings as shown simplifies the understanding of financial ratios. Parent accounts are totaling accounts for their child accounts. Quick Books chart of accounts does an excellent job aOperating Expense Dashboard
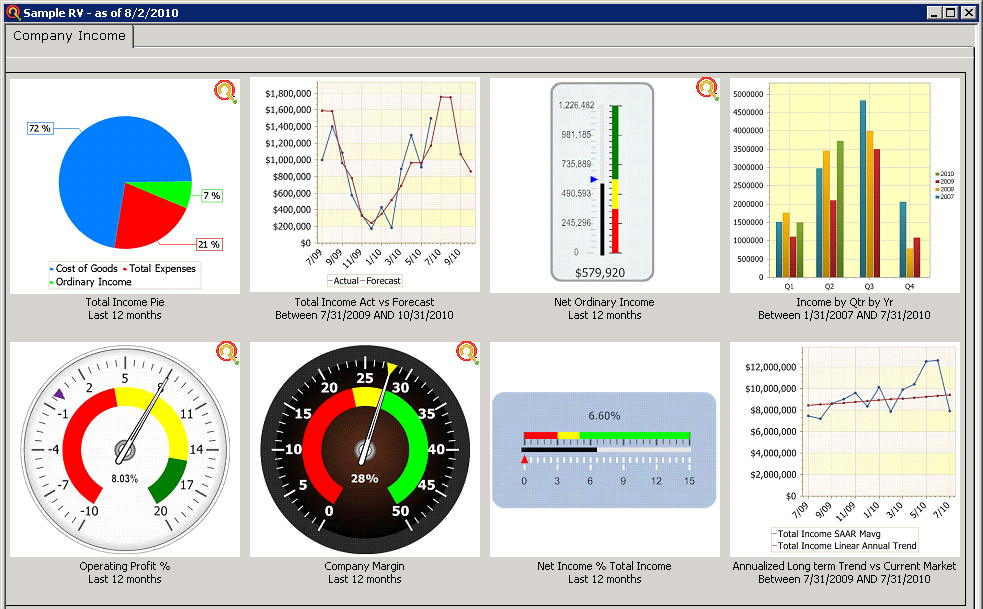
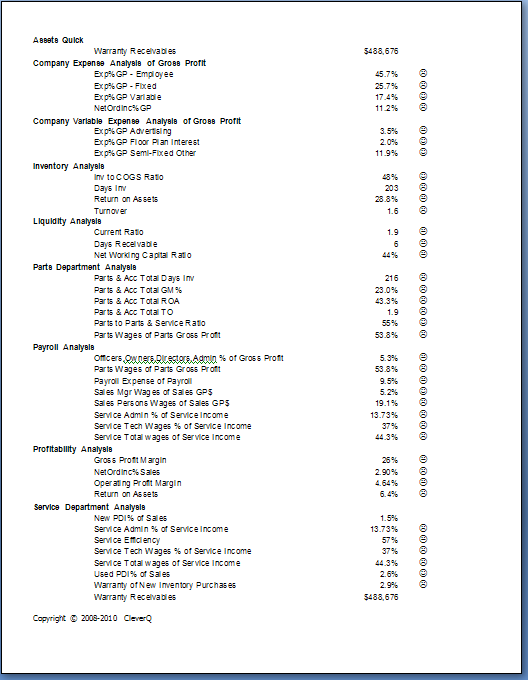
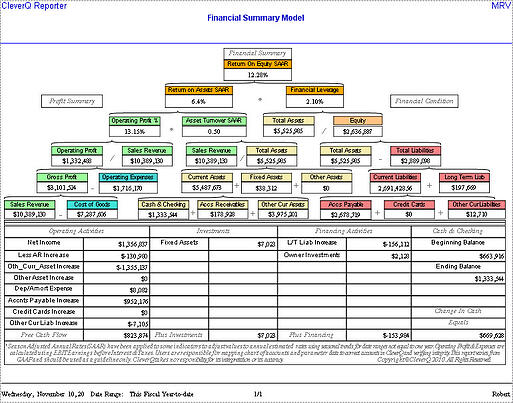
llowing for this methodology.  Successful companies, study groups and consultants commonly use this format to measure business performance. Grouping the chart of accounts is also important to compare company performance to Industry aggregate ratios if industry benchmarking is desired.  Pay special attention to the following key points.

    • If a company spends more than it makes, it will become a statistic.
    • Gross Profit is what the company makes after paying its suppliers.
    • Gross Profit is Total Income less Total COGS
    • Gross Profit is the total revenue at the company's disposal to both pay expenses and keep as ordinary income.
    • Since Gross Profit is what the company has at its disposal for expenses, we can now take the approach that we cannot spend more than we make without having a loss or negative Net Ordinary Income.
    • Expenses are broke down into Logical groupings and are grouped into Variable, Fixed, & Personal. When added to Net Ordinary Income, the total will be 100% of the Gross Profit.
    • Gross Profit = Variable Expenses + Fixed Expenses + Personal Expenses + Ordinary Income
    • Variable Expenses = Semi-Fixed Other + Advertising + Other Important variable Expense
    • Accounting Consistency and History are Key to seasonal trend analysis for forecasting and budgeting
    • Seasonality Forecasting of Income & COGS is first necessary to know how much Gross Profit we will have to spend on expenses.
    • Once seasonal trends are calculated from history for each expense bucket, monthly forecasting & budgeting can be implemented to proactively operate profitably.
    • The profit centers or departments all have mirrored Inventory, Income, COGS, and Personal expense to allow for departmentalized KPI development.
    • Each Department now can be measured to see if it can financially stand on its own, without being subsidized by another department after personal expense. 

    Sample Chart of Accounts Framework:

    • 10000 Assets
      • Current Assets
        • Bank Accounts
        • Accounts Receivable
        • Other Current (Inventory)
          • Inventory Profit Center A
            • Inventory Product type 1
            • Inventory Product type 2
            • Inventory Product type 3
          • Inventory Profit Center B
        • Total Other Current (Inventory)
      • Total Current Assets
      • Fixed Assets
      • Other Assets
      • Working Assets Profit Center D (e.g. Reoccurring Revenue)
    • Total 10000 Assets
    •  
    • 20000 Liabilities
      • Accounts Payable
      • Credit Cards
      • Other Current Liabilities
      • Long Term Liabilities
    • Total 20000 Liabilities
    •  
    • 30000 Equity
    •  
    • 40000 Income Accounts
      • Profit Center A Income (Sales Dept)
        • Income Product type 1
        • Income Product type 2
        • Income Product type 3
      • Profit Center B Income (Parts Dept)
      • Profit Center C Income (Service Dept)
      • Profit Center D Income (e.g. Reoccurring Revenue)
    • Total 40000 Income
    •  
    • 50000 COGS Accounts
      • Profit Center A COGS (Sales Dept)
        • COGS Product type 1
        • COGS Product type 2
        • COGS Product type 3
      • Profit Center B COGS (Parts Dept)
      • Profit Center C COGS (Service Dept)
      • Profit Center D COGS (e.g. Reoccurring Revenue Dept)
    • Total 50000 COGS
    • Gross Profit
    •  
    • 60000 Variable
      • Other Important Variable Expense(e.g., Research & Development, Inventory Interest/Floor Plan etc.)
      • Advertising Expense (e.g., Web, Yellow Pages, TV, etc.)
      • Semi-Fixed Other (e.g., Good Will, Professional Fees, Repairs & Maintenance, Office Supplies, Continued Education, Misc Variable)
    • Total 60000 Variable
    • 66000 Employee Expense
      • Owner/GM/CEO
      • Administration
      • Profit Center A Wages
        • Management A Wages
        • Staff A Wages
      • Profit Center B Wages
        • Management B Wages
        • Staff B Wages
      • Profit Center C Wages
        • Management C Wages
        • Staff C Wages
      • Profit Center D Wages
        • Management D Wages
        • Staff D Wages
      • Payroll Expenses
    • Total 66000 Employee Expense
    • Total 69000 Fixed Expenses (e.g., Depreciation and Amortization, Insurance, Rent/Mortgage, Utilities, Data Processing, Business Loan Interest)
    •  
    • Total Expense
    •  
    • Net Ordinary Income
    • Total 70000 Other Income (Non Operating e.g, Insurance Proceeds, Interest Income, Earned Discounts, Proceeds from Sale of assets, Deposits forfeited
    • Total 80000 Other Expenses (Non Operating)
    • Total 90000 Taxes e.g., Provision for Income Tax
    •  
    • Net Other Income
    • Net Income

    Copyright © 2008-2010 CleverQ

    Tags: QuickBooks Dashboard, Business KPI Strategy, Financial KPI

    Data Visualization Technology for Employee Performance Measurement.

    Posted by Robert Trupe
     

    In many cases, managers fail to provide proper employee performance reviews. At times, we spend more time managing the underperformers than we do supporting the high performers who are generating the majority of the productivity for the company. Most managers many times do not have the time, tools or knowledge to properly appraise employee performance. Furthermore, the process of filling out forms performing reviews is monotonous, sometimes a waste of time, and many times counterproductive.

    I had a conversation with a business associate whom is a department manager for one of the largest retailers in the country. His remarks reminded me of prior experiences with overachieving employees. He was trying to find a method to measure his, as well as his department's performance.

    The scenario was always similar. The best employees would knock on my office door. I would invite them in to sit down. After the small talk, I would ask what's on your mind. Then the question would finally come out in the fashion of "How am I doing at my job? Are you happy with my performance?" Shame on all of us as leaders and coaches! We sometimes spend so much time chasing rabbits, putting out fires, and dealing with the problem child, that we don't take time for our primary responsibility - Manage People. We sometimes ignore the best performers.

    When you send your child to school, how important is it to grade every quiz and test? Do you think the child benefits by knowing their grade and attendance record? Do they respond well to a good grade, praise, and a pat on the back? Do you think they are proud of a good report card or disappointed in themselves when they under achieve?

    Overachievers are nearly always self motivated and want to know their performance. Employee KPI, Employee Performance Scorecards, employee dashboards are as important to the employee as the financial reports and financial ratios are to the GM or CEO. Employee Performance measurement should be made available to employees regulData Visualization Technologyarly so individuals can manage their success.


    Steps to develop KPI:

    • Organize a focus group. It should include the people taking the calls, fixing the problems, responsible for finances, etc. Keep the group well rounded with members who deal with the same problems from different perspectives, large enough to get different ideas, and small enough that decisions can be made.
    • Break down complaints, failures, problems into categories, this may come from support staff.
    • Try to keep the categories to around 8 for each sector of your business. Too many KPI for one department can become unmanageable.
    • Talk about how they relate to CSI, Costs, Efficiencies, and Revenues
    • Revisit each KPI and ask the group if each is important to monitor, or if it is a waste of time.
    • Talk about what information needs to be collected, or is being collected to measure it, or can it be collected.
    • What policies or procedures will be implemented to collect the data
    • How will it be reported
    • Who will be responsible for the project and reporting
    • How often will it be reviewed in scheduled meetings
    • Keep involving the team as to the resolutions of the KPI which are out of the desired range
    • Review your KPI periodically and decide if they are worth monitoring.


    To implement a successful strategy, people must be involved in the process from the beginning. It's important that everyone buy in and take ownership. The key to developing a set of KPI is to develop a set which can be measured, and are able to put a plan into action to improve upon. History is the Key to understanding improvement!

    Tags: Business KPI Strategy, Financial KPI, Data Visualization Technology, Employee Performance Measurement